Add the Gadget to a Dashboard
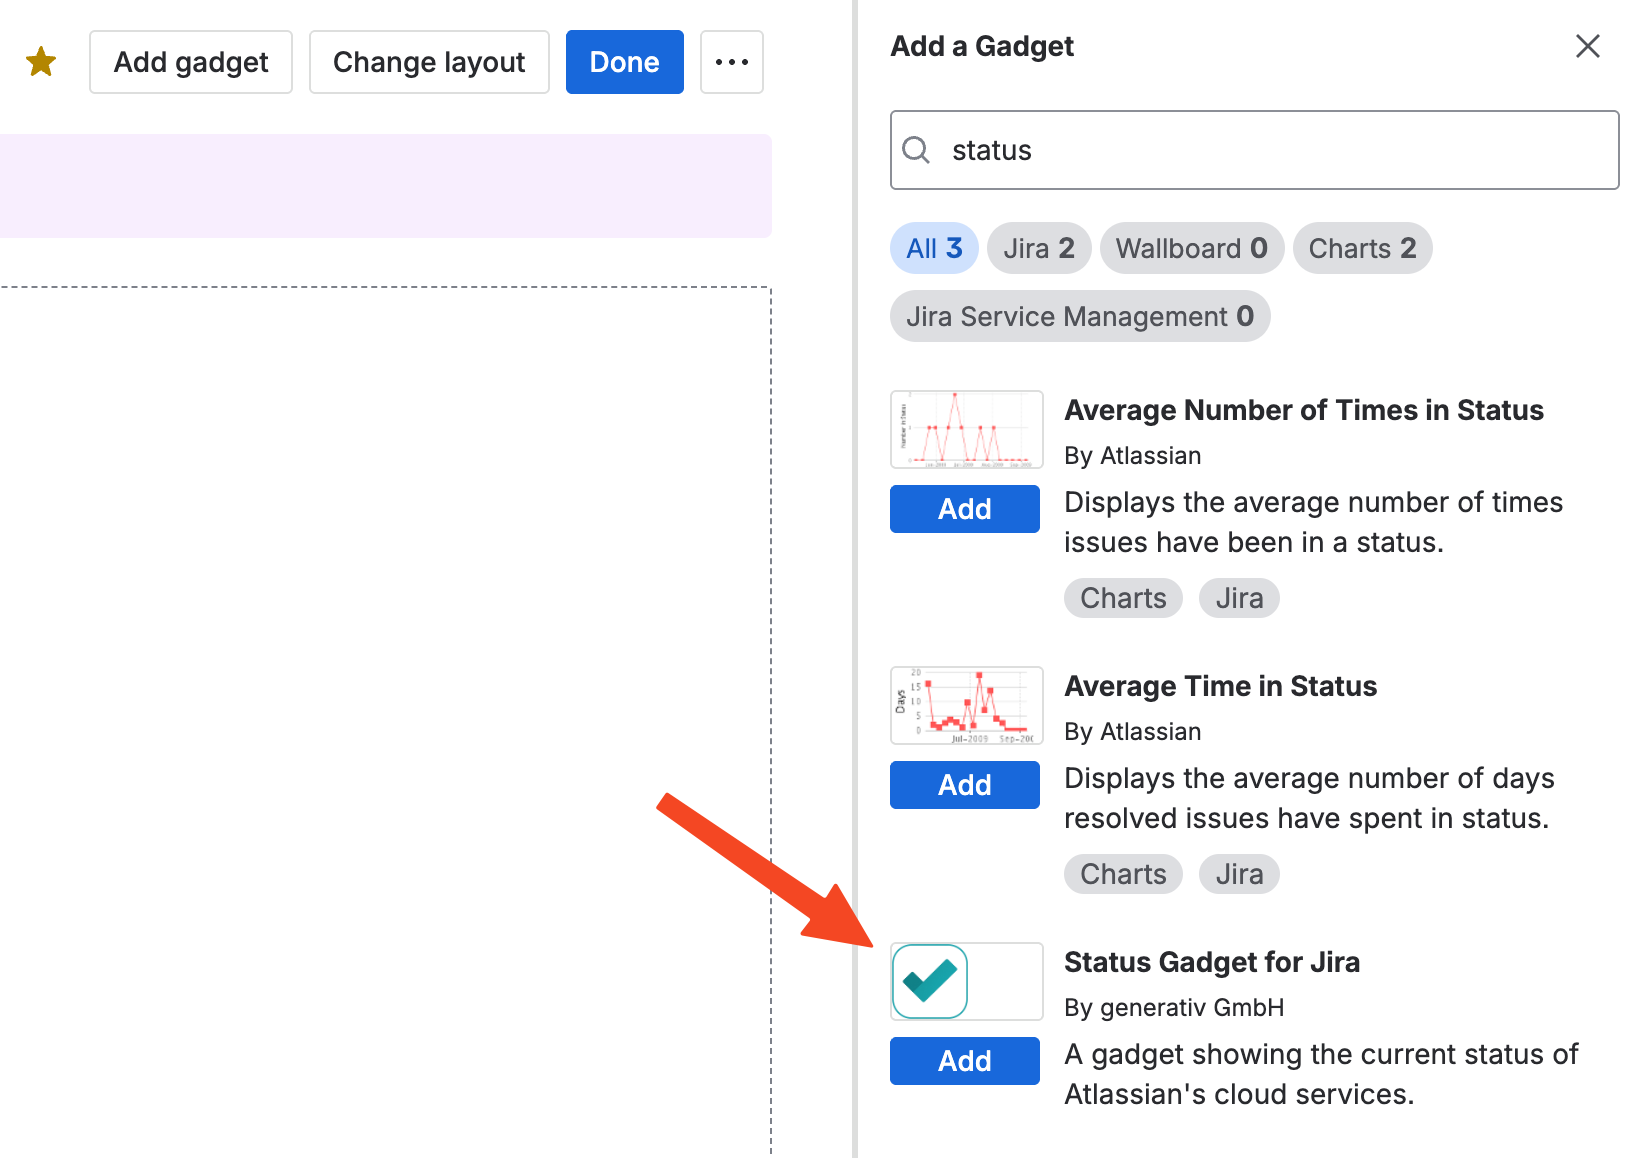
After installing the app, add the gadget to any Jira dashboard. Edit the dashboard and select Status Gadget for Jira from the gadget selector:
Configure the Gadget
After adding the gadget, configure it and define the Atlassian services to monitor:
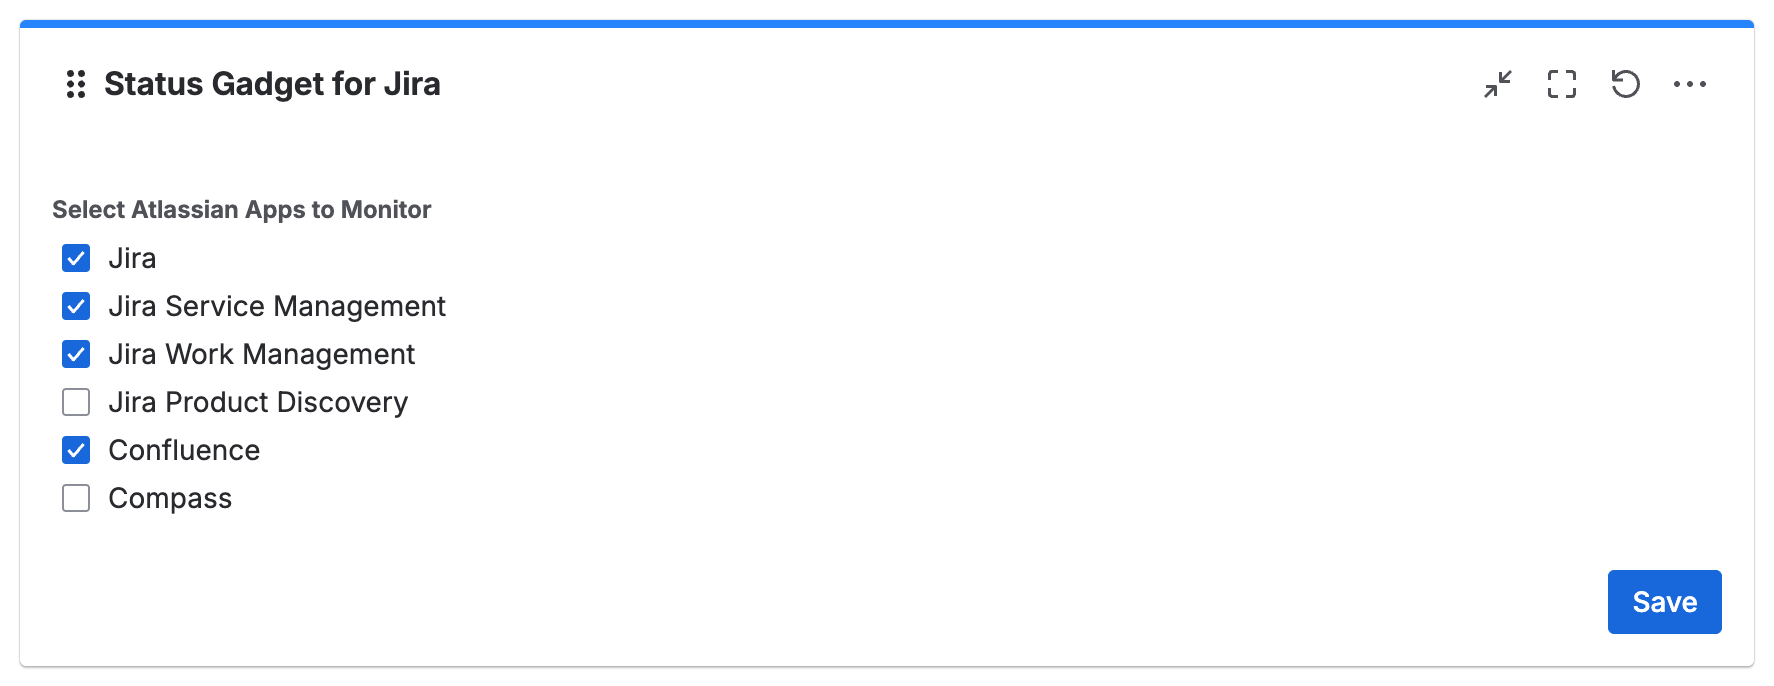
Select the desired services, then click Save.
Use the Gadget
The gadget is ready and displays the status of the selected Atlassian services:
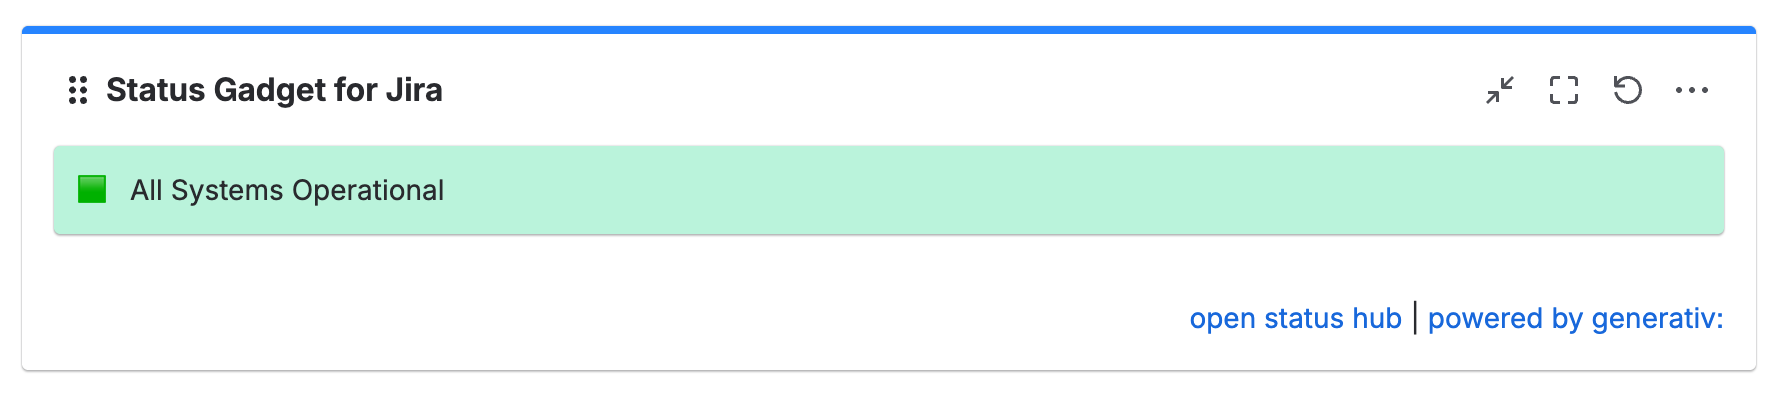
For incidents, outages, or maintenance, click an entry to open its details page on status.atlassian.com.
Click open status hub at the bottom right to open status.atlassian.com directly from the gadget.
Happy monitoring!